The 20 dimensions behind the Global Fear & Greed Index
A guide to trading behaviour, derivatives, public sentiment, capital flows and cross-asset stress in FusionIntel’s model framework.
Maintained by FusionIntel Labs · Product documentation and data interpretation
A price change shows what happened, but it does not fully explain the behaviour behind it. FusionIntel’s 20-dimension framework examines what is traded, where capital moves, how investors express expectations and how risks travel between markets.
How the dimensions fit together
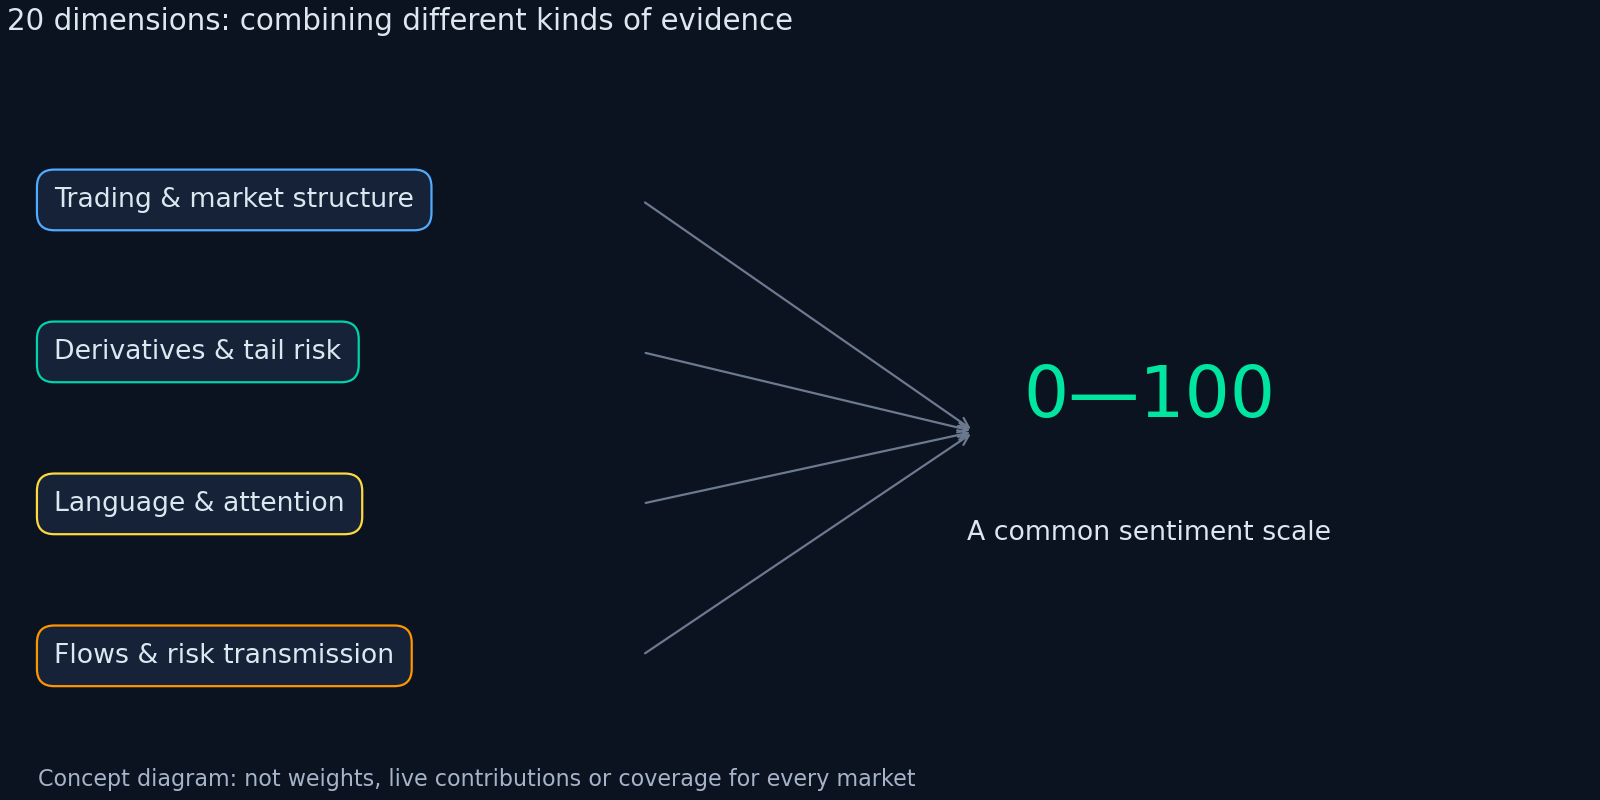
The diagram groups the dimensions by the kind of evidence they provide. It is a conceptual map, not a chart of factor weights or current contributions. Inputs can have different update frequencies and market coverage.
The 20 dimensions, explained
1. Volatility
Observe changes in expected volatility and whether demand for protection is increasing.
2. Market momentum
Measure the position of major equity indices relative to medium- and long-term trends.
3. Market breadth
Compare advancing and declining stocks to assess participation in a market move.
4. Market microstructure
Examine order-flow imbalance, aggressive buying and selling, order-book depth and price impact.
5. Price–volume structure
Examine how trading activity relates to the direction of price changes.
6. Safe-haven preference
Observe shifts in risk preference across equities, bonds, gold and other assets.
7. Options sentiment
Compare put and call activity to understand defensive demand and optimistic expectations.
8. News sentiment
Identify entities and events in financial news, score sentiment and reduce duplicate-report and headline noise.
9. Social-media sentiment
Examine tone, propagation, engagement and disagreement in public discussion.
10. Investor surveys
Track bullish, bearish and neutral expectations and their historical percentiles.
11. Search attention
Measure unusual interest in risk and market keywords to observe shifts in attention that may precede trading.
12. Fund and ETF flows
Track subscriptions, redemptions, net flows and changes in asset allocation.
13. Leverage and margin activity
Assess financing balances, leverage growth and available cash to understand buying capacity and deleveraging pressure.
14. Volatility term structure
Compare implied volatility across maturities to distinguish near-term stress from longer-term expectations.
15. Options skew and tail protection
Examine out-of-the-money put premiums and the volatility surface to assess the cost of downside protection.
16. Liquidity stress
Examine spreads, depth, price impact and turnover efficiency for signs that thinning liquidity is amplifying stress.
17. Correlation and dispersion
Compare common movements and individual differences to assess the spread of risk across a market.
18. Style rotation
Track relative performance and allocation shifts between growth and value, defensive and cyclical, and large and small companies.
19. Valuation and crowding
Combine valuation percentiles, trading concentration, turnover and crowded positioning to assess stretched expectations.
20. Cross-asset financial stress
Assess spreads, currencies, rates, credit and commodity links to understand risk transmission.
Related measures answer different questions
Volatility, its term structure and options skew are related but distinct: they describe the level of expected movement, its distribution across time and the relative cost of protection against different outcomes. Market breadth describes participation; correlation describes how closely securities move together.
News and social-media sentiment describe public expression, while flows and leverage describe financial commitments. Attention does not always become a trade. Several correlated measures should not be interpreted as several independent confirmations.
Publication time and coverage matter
For example, AAII’s survey asks individual investors about their six-month US stock-market outlook and reports weekly. That is a different horizon from an order-book observation. It illustrates why release schedules and scope matter; it does not mean this specific survey is an input to every FusionIntel series.
The methodology includes cleaning, normalization, smoothing and dynamic calibration. Exact weights and the full historical revision process are not disclosed here. Readers should distinguish a model overview from a complete reproducibility specification.
Frequently asked questions
Does every dimension have a 5% weight?
No equal-weight assumption follows from the number of dimensions. This article does not publish the weights.
Are all inputs available for every market?
Coverage and update frequency vary by market and data type. A 20-dimension framework does not establish identical inputs for every series.
Sources and data notes
Published on 24 October 2026. The methodology overview is maintained by FusionIntel Labs; figures identify their own observation windows. This article does not automatically update with the market.