How to read a fear & greed index: level, direction and persistence
Read the five sentiment bands and avoid confusing extreme readings with trading signals. Includes a real 30-observation A-share distribution.
Maintained by FusionIntel Labs · Product documentation and data interpretation
The most useful reading combines three observations: where the score is, which way it is moving and how long it has stayed in an extreme region. A single unusually high or low number cannot answer all three.
The five sentiment bands
From 24 October 2026, FusionIntel uses the five bands below for current explanations. Integer labels are shorthand: decimal scores are classified as 0–20, above 20 through 40, above 40 through 60, above 60 through 80, and above 80 through 100. Thus 20.5 belongs to Fear without rounding it to a whole number.
| Score label | Sentiment |
|---|---|
| 0–20 | Extreme fear |
| 21–40 | Fear |
| 41–60 | Neutral |
| 61–80 | Greed |
| 81–100 | Extreme greed |
What does persistence look like in real data?
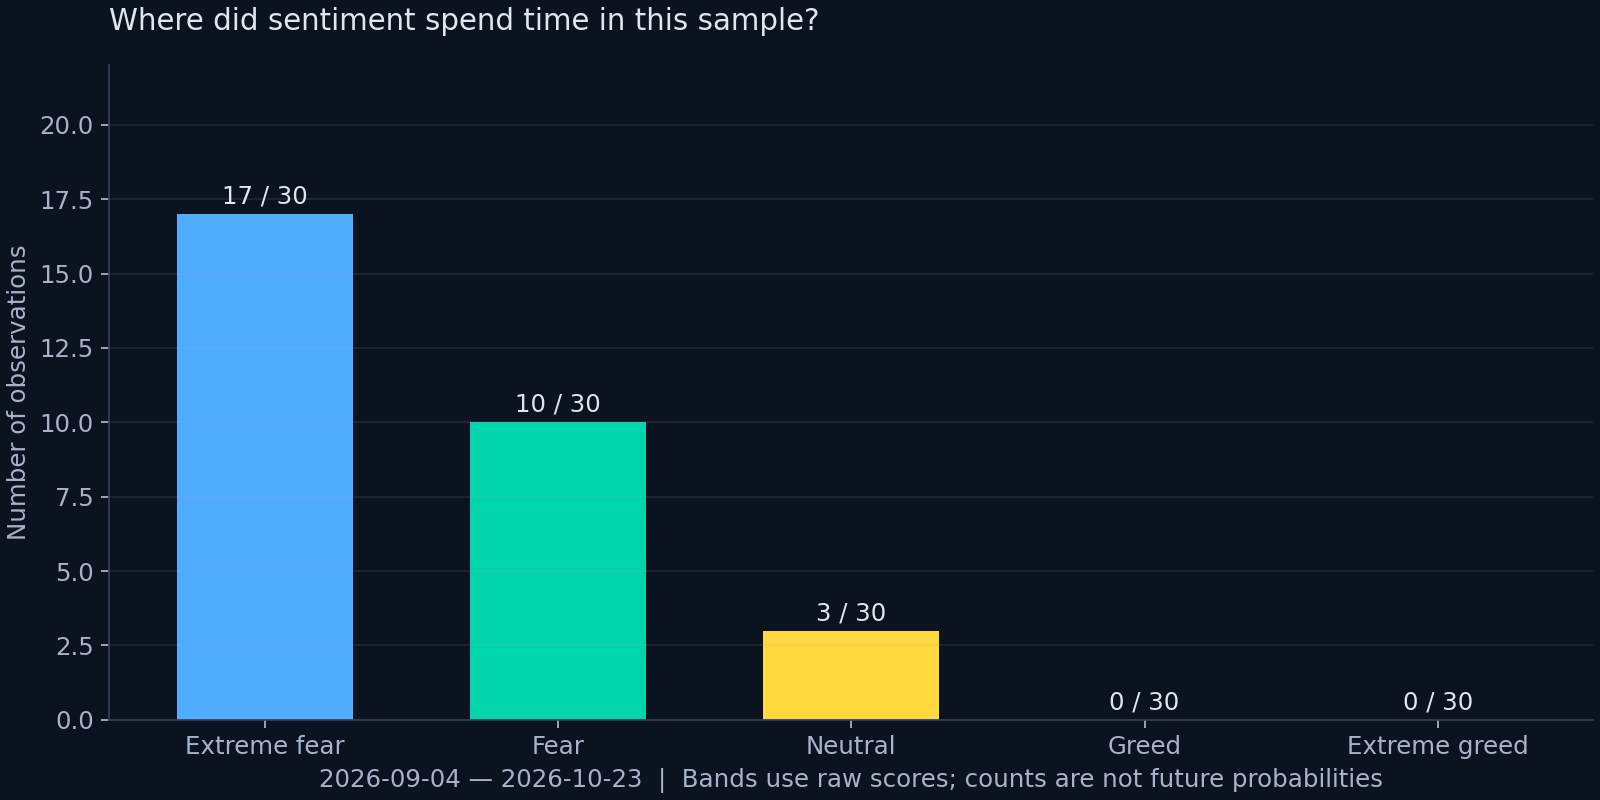
In the 30 observations from 4 September to 23 October 2026, 17 fall in Extreme Fear, 10 in Fear and 3 in Neutral. There are no Greed or Extreme Greed observations in this selected window. The final score is 5.01, and the final 15 observations are all at or below 20.
These are counts in one recent sample, not a long-run frequency estimate or a probability of future returns. Consecutive observations are also related to one another. The example shows why an extreme reading can recur without announcing an immediate turning point.
A practical reading sequence
- Level: identify the market, date and sentiment band. The same number means little if the instrument or timestamp is wrong.
- Direction: inspect consecutive observations and distinguish a modest recovery within fear from a move into a different band.
- Validation: compare the reading with valuation, fundamentals and liquidity, and assess it against your own risk capacity.
Common interpretation errors
A move from 5 to 10 is a five-point change, while both values remain in Extreme Fear. Calling it a 100% improvement exaggerates what the scale establishes. Likewise, a high score does not define a short-selling opportunity, and neutral sentiment does not eliminate risk.
Do not infer a successful strategy from a selected historical chart. A strategy study needs rules stated in advance, usable timestamps, trading costs and a separate evaluation sample. Changing the current band labels does not retroactively change old experimental thresholds.
Data dates and methodology versions
An API fetch time tells you when data was retrieved, not when the market observation occurred. Check latest_date and row dates. Older studies on this site retain their original 15/30/70/85 research buckets where explicitly labeled; they must not be read as the current five-band definitions.
Frequently asked questions
Should I buy whenever the index enters Extreme Fear?
No. The band describes sentiment, not a trading instruction. Extreme sentiment can persist and other risks can worsen.
Does a higher score always mean the outlook improved?
It indicates a shift toward greed on this scale. That does not by itself establish better fundamentals, cheaper valuation or a more attractive expected return.
Sources and data notes
Published on 24 October 2026. The methodology overview is maintained by FusionIntel Labs; figures identify their own observation windows. This article does not automatically update with the market.