Global Fear & Greed Index: turning market psychology into a 0–100 score
FusionIntel Labs explains the sentiment scale, multi-source data process and limits, with a dated A-share example comparing sentiment and prices.
Maintained by FusionIntel Labs · Product documentation and data interpretation
Prices record outcomes; sentiment often influences the process. The Global Fear & Greed Index combines evidence from trading behaviour, derivatives, fund flows, language and cross-asset stress into a 0–100 score that makes market sentiment easier to track.
What does a fear & greed index measure?
A fear & greed index describes the risk appetite expressed by market participants in a particular market and period. Lower scores indicate stronger fear; higher scores indicate stronger greed. These terms summarize behaviour and expectations, rather than diagnose individual investors.
The 0–100 scale is not an upside probability, expected return or valuation multiple. A score of 80 does not mean an 80% chance of a price rise. A low reading does not establish that the market has reached a bottom.
Global coverage consists of distinct market series
FusionIntel provides separate series for A-share macro sentiment, sectors, individual stocks and ETFs, as well as Hong Kong markets, US sectors and commodities. Each series has its own instrument code, observation dates and history. Macro sentiment describes the broad environment; sector sentiment helps reveal differences within it.
Align observation dates and definitions before comparing markets. Equal sentiment scores do not imply equal volatility, investment risk or future returns. The chart below covers one A-share macro sample, not the simultaneous state of every market.
How do different data sources become a common score?
FusionIntel’s 20-dimension framework examines trading, capital flows, public discussion and cross-asset risk. The methodology describes cleaning, outlier handling, normalization, time-series smoothing and dynamic weight calibration to combine inputs with different units and frequencies.
- Identify the market, observation time and release schedule before combining inputs.
- Separate genuine extreme observations from duplicate records and data errors.
- Align the direction and scale of the dimensions before aggregation and smoothing.
- Check coverage and freshness alongside the resulting score.
A dated example: read sentiment and prices separately
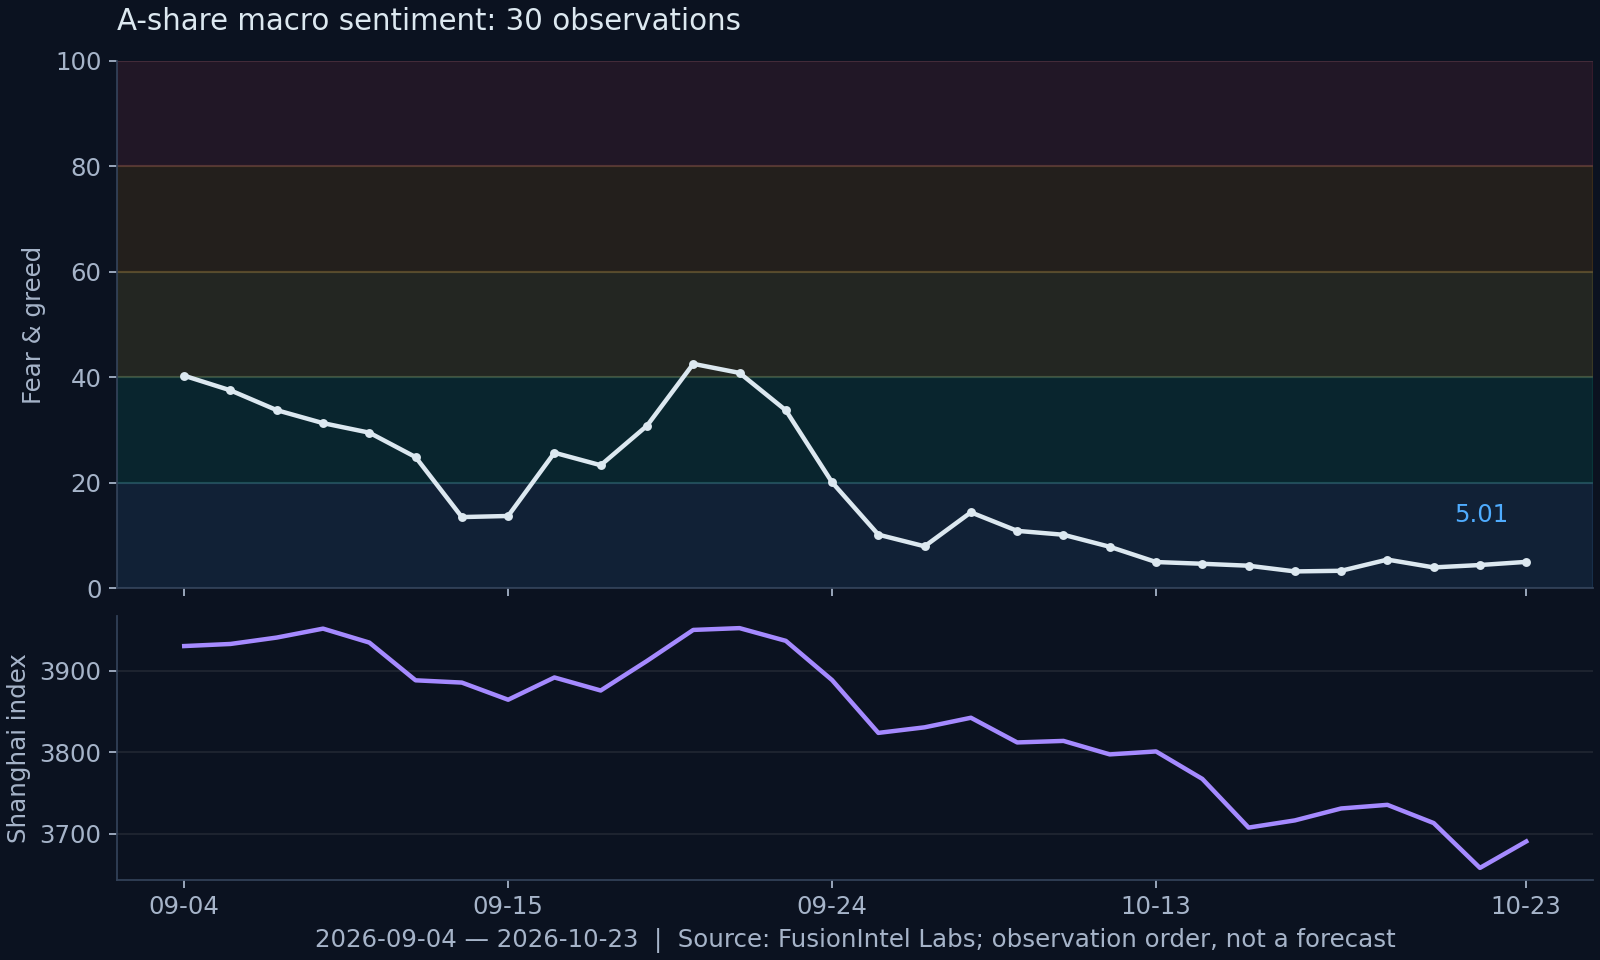
This chart uses FusionIntel’s A-share macro series, shi_feargreedindex. It contains 30 observations from 4 September to 23 October 2026. The API window is named 30d; this figure counts the records actually returned and does not describe them as 30 consecutive calendar days.
The first score is 40.30, the last 5.01, the minimum 3.20 and the maximum 42.55. The lower panel shows the Shanghai Composite values supplied in the same records on a separate axis. Co-movement in this sample does not establish causation or prove that sentiment leads prices.
What does a single number leave out?
Aggregation makes a market easier to monitor but compresses detail. The same total score can reflect different combinations of flows and news. A neutral macro reading can coexist with strongly fearful and greedy sectors. Use the total to locate the environment, then return to the relevant market data.
The 20 dimensions describe the model framework, not identical input availability in every market on every date. This article does not disclose full weights, live factor contributions or the complete revision history. The process description is not a formula for reproducing every historical value.
Use sentiment within a research process
Confirm the market and observation date first. Then examine the level and its path, and compare the reading with valuation, fundamentals and liquidity. Describe stale or missing observations explicitly before interpreting the score.
Frequently asked questions
Does a score of zero guarantee a rebound?
No. Zero indicates extreme fear on this scale. Earnings, liquidity and credit risks can still affect prices, and extreme sentiment can persist.
Is this the same as VIX?
No. VIX measures expected S&P 500 volatility over roughly 30 days using option prices. FusionIntel uses a multi-dimensional sentiment framework. The definitions, coverage and scales differ.
Sources and data notes
- FusionIntel data coverage and methodology
- API fields and observation dates
- S&P Dow Jones Indices: VIX definition
Published on 24 October 2026. The methodology overview is maintained by FusionIntel Labs; figures identify their own observation windows. This article does not automatically update with the market.